


The True Cost of Homeownership Index: Annual Hidden Expenses Across America's 50 Largest Cities

Buying a home is often considered the ultimate milestone of financial stability. But most homeowners dramatically underestimate the true cost of ownership.
Beyond the monthly mortgage payment, property taxes, insurance, utilities, and ongoing maintenance can add tens of thousands of dollars to annual expenses. These hidden costs vary wildly by location, and in some cities, they can exceed what many families pay in rent.
To uncover the full financial burden of homeownership across America's largest cities, PropFusion analyzed the total annual costs in the 50 most populous U.S. cities.
The study combined median home values from Zillow with property tax rates from the Lincoln Institute, homeowners insurance data from Nerdwallet, and utility costs from Doxo Insights. Each city was ranked by total annual cost, accounting for property taxes, insurance, utilities, energy, and the standard 2% home maintenance rule.
Key Findings
- The median homeowner in America's largest cities pays $22,428 annually in hidden costs beyond their mortgage, including property taxes, insurance, utilities, and maintenance.
- San Jose, California leads the nation with the highest annual homeownership costs at $56,587, driven by sky-high property values and maintenance expenses.
- Philadelphia, Pennsylvania offers the most affordable homeownership at $16,309 annually, making it 71% less expensive than San Jose.
- California cities dominate the top tier, claiming 6 of the 10 most expensive cities for homeowners, while Midwest cities like Detroit, Indianapolis, and Columbus rank among the most affordable.
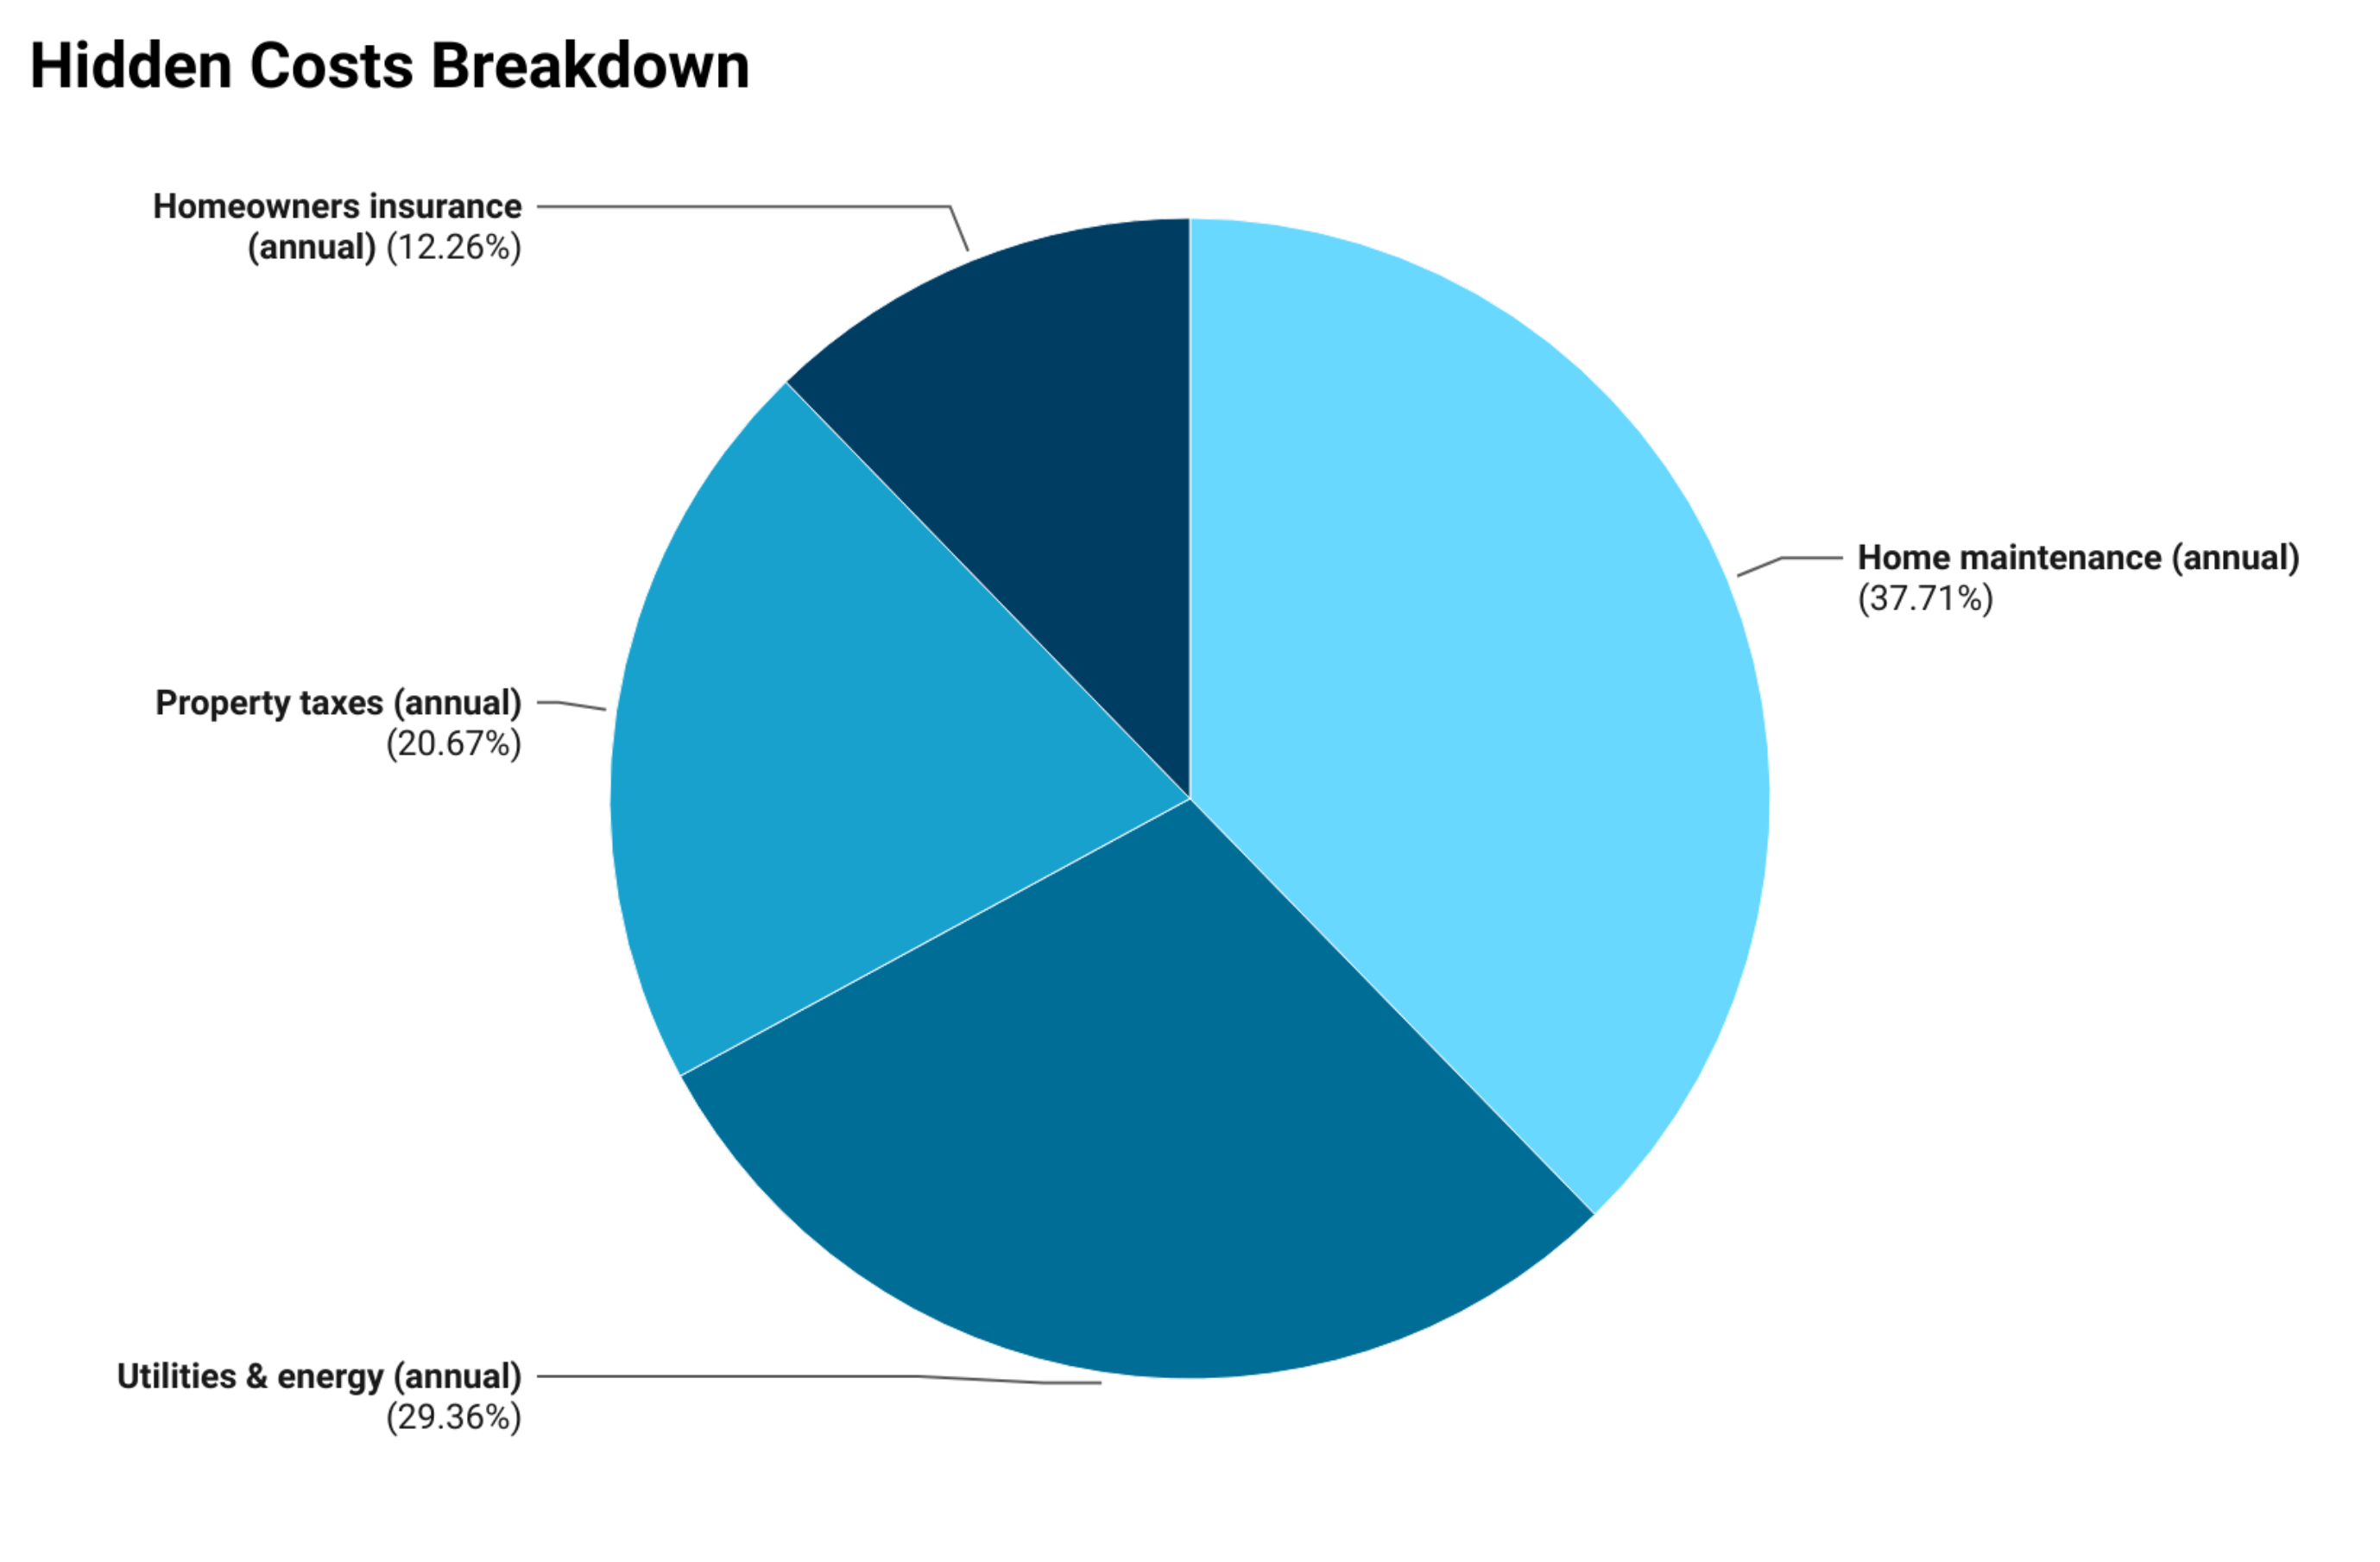
- Home maintenance costs represent the single largest hidden expense for homeowners at a median of $7,785 annually, accounting for 37.71% of all hidden costs, more than property taxes, insurance, and utilities individually.
The Five Cities With the Highest Hidden Homeownership Costs
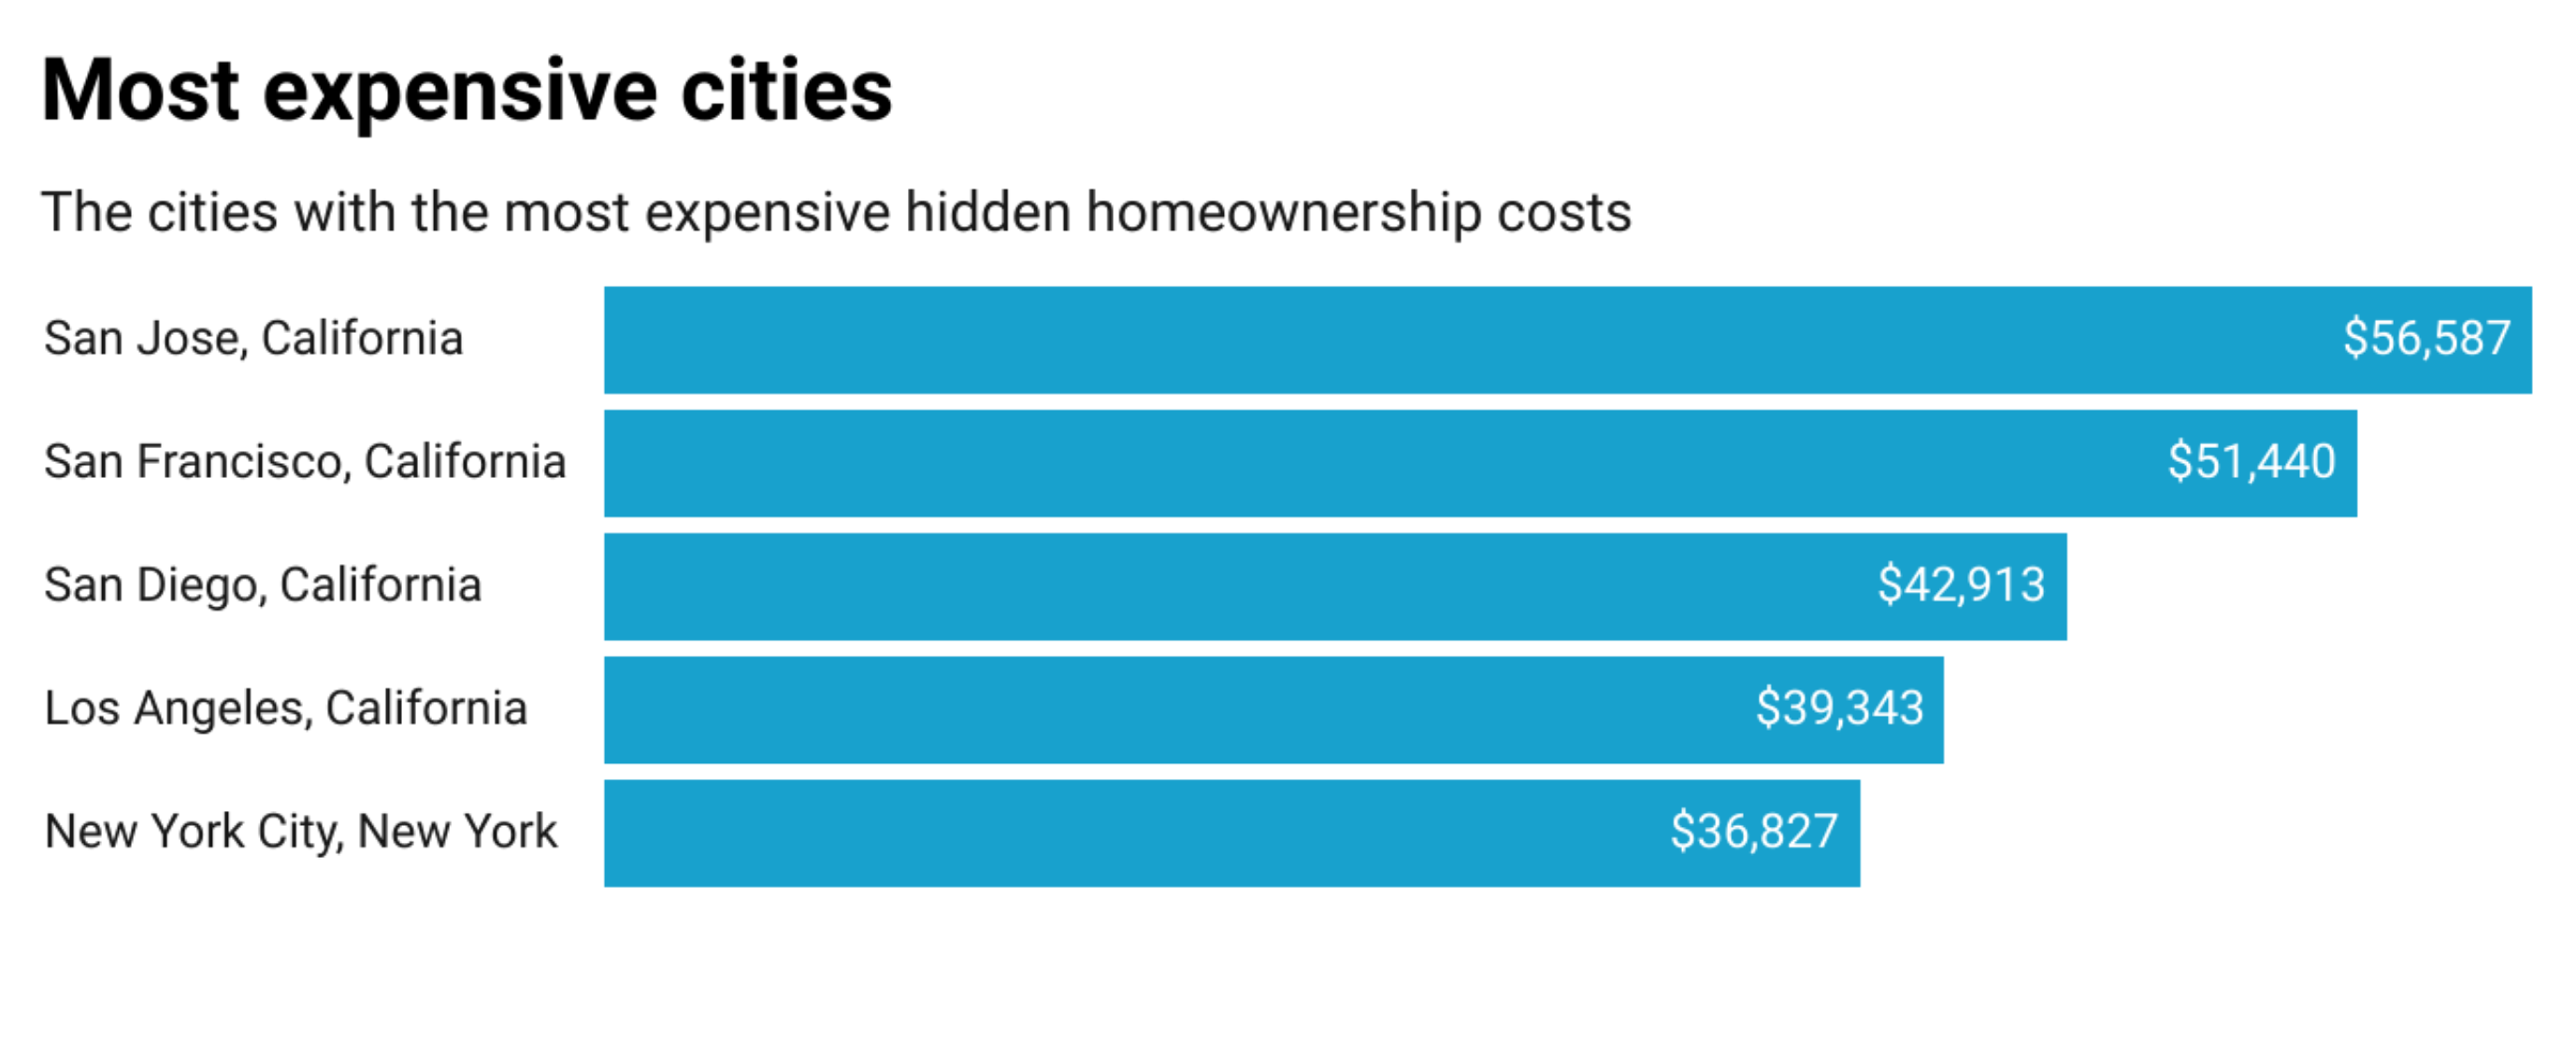
San Jose, California - $56,587 per year
San Jose homeowners carry the nation's heaviest burden of hidden costs at $56,587 annually, more than double the national median of $22,428. Home maintenance represents the single largest expense, accounting for nearly half of all hidden costs due to sky-high property values. In a surprising twist, San Jose boasts the lowest homeowners insurance in the country at just $1,090 per year, less than one-sixth of what Oklahoma City homeowners pay despite having homes worth nearly seven times more.
San Francisco, California - $51,440 per year
San Francisco homeowners face annual hidden costs of $51,440, with utility and energy expenses ranking as the fourth highest in the nation. The combination of older housing stock and California's energy prices drives these costs significantly above the national average, adding substantial financial burden beyond property taxes and insurance premiums.
San Diego, California - $42,913 per year
San Diego claims the third spot among America's most expensive cities for homeowners, with annual hidden costs reaching $42,913. Property taxes and maintenance expenses dominate the cost structure, driven by median home values approaching the million-dollar mark in this coastal Southern California market.
Los Angeles, California - $39,343 per year
Los Angeles homeowners spend $39,343 annually on hidden costs, though the city offers a relative bargain in utility expenses compared to other expensive California markets. Despite having the fourth-highest median home values in the nation, Los Angeles maintains more moderate energy and utility costs than its northern California counterparts.
New York City, New York - $36,827 per year
New York City stands as the only non-California city in the top five, with homeowners spending $36,827 per year on hidden costs. Insurance premiums reach the highest levels among the top five cities, reflecting the unique risks and density challenges of America's largest metropolitan area.
The Five Most Affordable Cities for Hidden Homeownership Costs
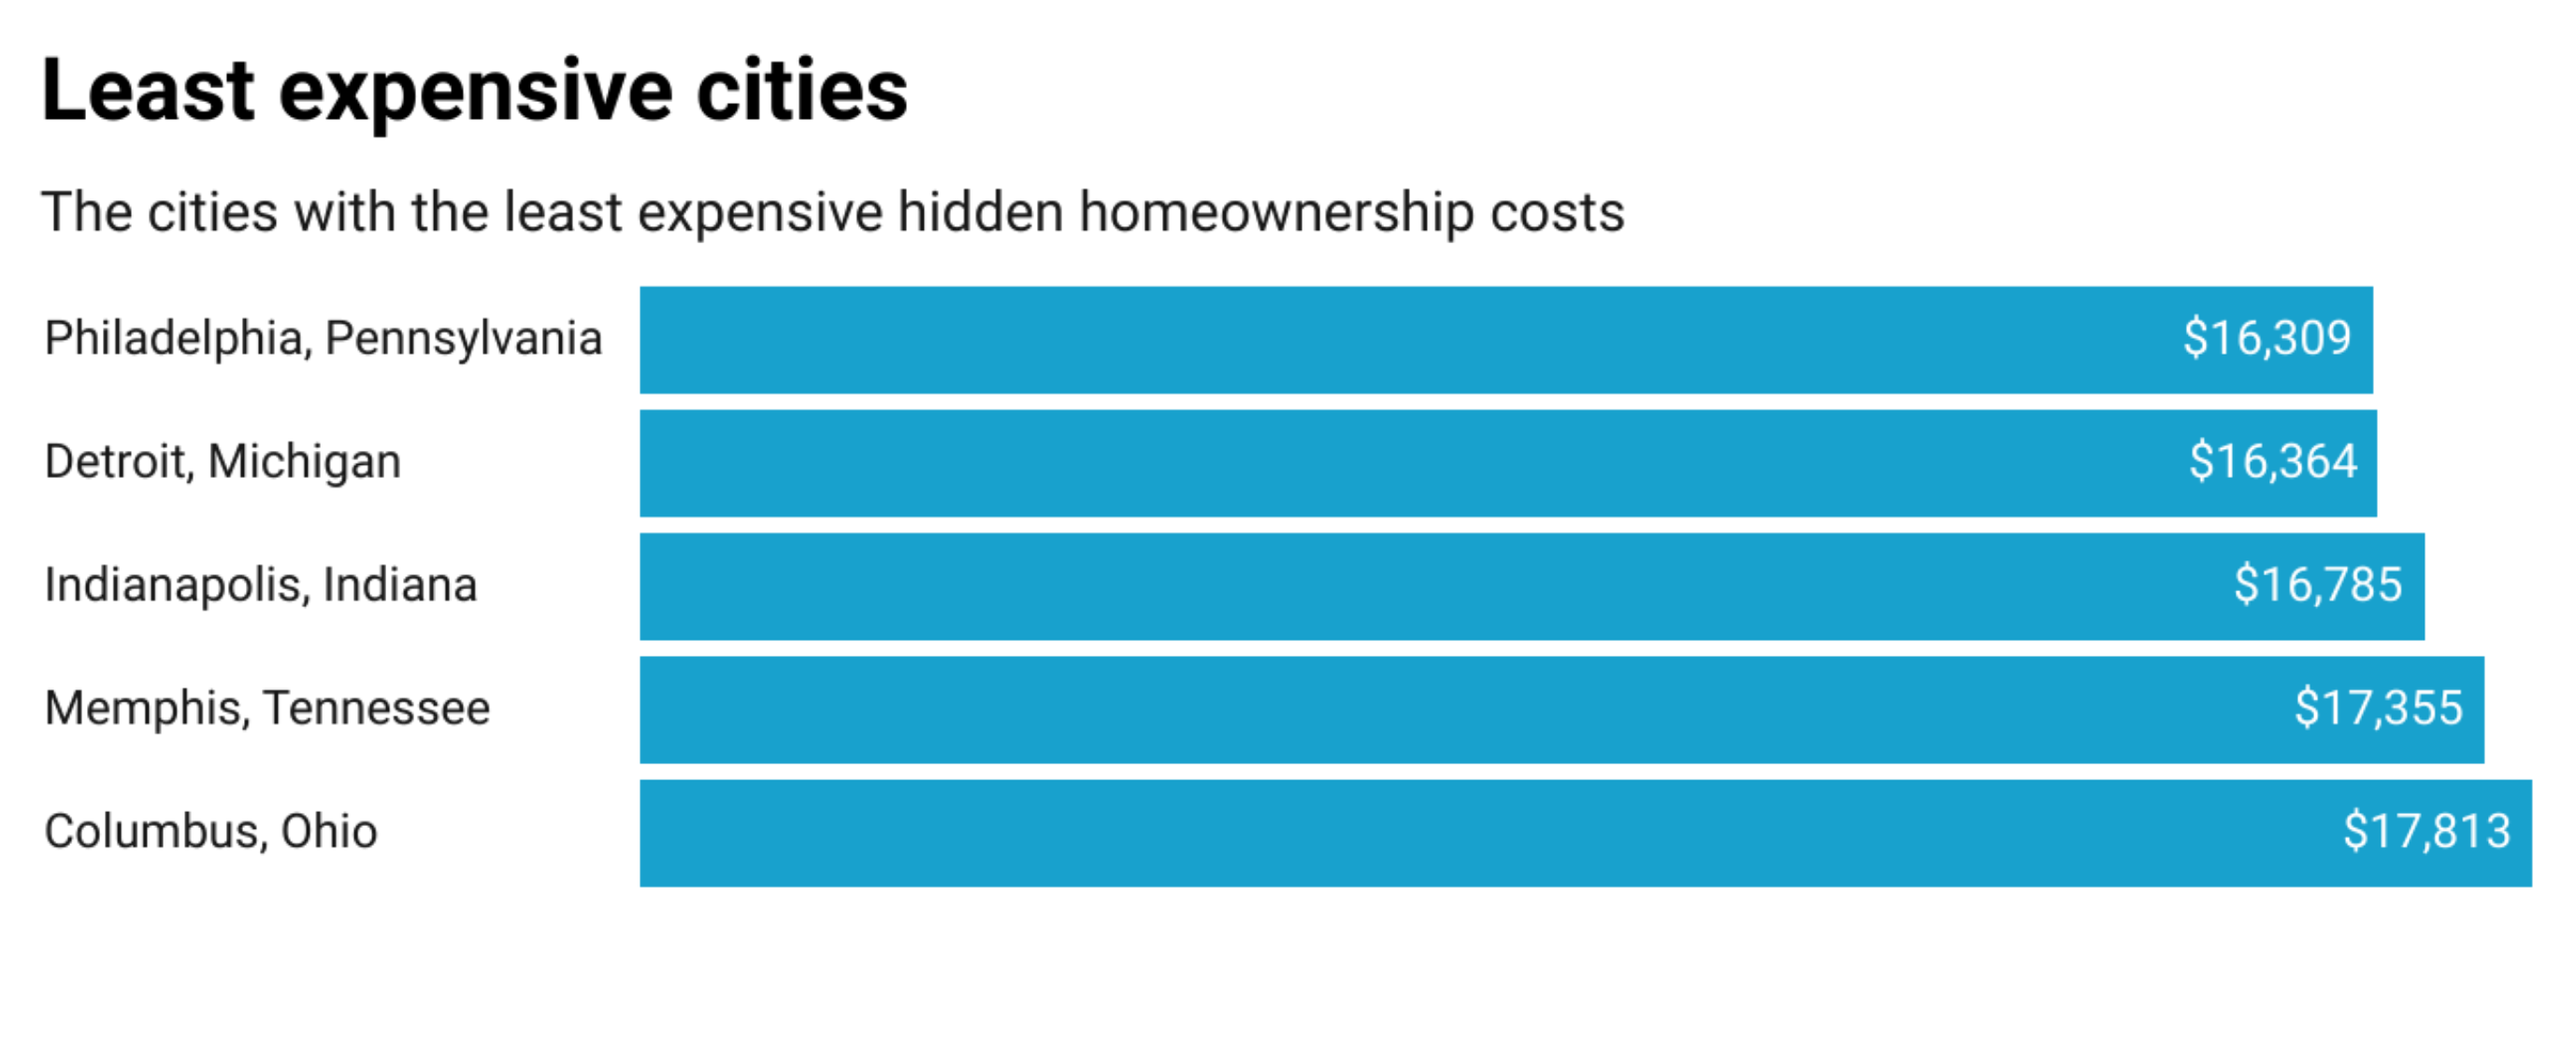
Philadelphia, Pennsylvania - $16,309 per year
Philadelphia offers the most affordable homeownership costs among the 50 largest U.S. cities, with annual hidden expenses totaling just $16,309. This represents 27% below the national median, making it an attractive option for cost-conscious homebuyers. The combination of moderate property values, reasonable tax rates, and manageable utility costs creates a favorable environment for long-term homeownership affordability.
Detroit, Michigan - $16,364 per year
Detroit homeowners face annual hidden costs of $16,364, the second-lowest among major cities analyzed. However, the city carries the highest property tax rate in the study at 3.13%, more than six times higher than some low-tax cities. This heavy tax burden is offset by Detroit's remarkably low median home value of $78,807, the cheapest in our analysis, which keeps absolute dollar amounts manageable despite the steep percentage rate.
Indianapolis, Indiana - $16,785 per year
Indianapolis ranks as the third most affordable city with annual hidden costs of $16,785. The city boasts the third-lowest utility and energy expenses among all 50 cities analyzed, helping homeowners stretch their budgets further. Combined with moderate property values and reasonable insurance rates, Indianapolis presents a compelling case for affordable homeownership in the Midwest.
Memphis, Tennessee - $17,355 per year
Memphis homeowners spend $17,355 annually on hidden costs, supported by the second-cheapest median home values in our study at just $143,248. However, the city faces notably high utility expenses that partially offset its housing affordability advantages, requiring homeowners to budget carefully for ongoing energy costs.
Columbus, Ohio - $17,813 per year
Columbus rounds out the five most affordable cities with annual hidden costs of $17,813. The city benefits from balanced expenses across all categories, with no single cost driver standing out as exceptionally high or low, creating predictable budgeting conditions for homeowners in Ohio's capital.
Complete Rankings: Hidden Homeownership Costs Across America's 50 Largest Cities
The complete rankings reveal stark regional patterns in homeownership affordability across the United States.
California dominates the expensive end of the spectrum, claiming six of the top ten most costly cities, while Midwestern and Southern cities consistently rank among the most affordable options.
Texas cities show significant variation, with some appearing in the top tier due to high insurance costs while others remain relatively affordable.
The data demonstrates that hidden homeownership costs can vary by more than $40,000 annually between the most and least expensive major cities, a difference that significantly impacts long-term wealth building and quality of life for American homeowners.
The American Homeowner: A Financial Portrait
The typical homeowner in America's 50 largest cities spends $22,428 annually on hidden costs beyond their mortgage payment. With a median home value of $389,241 and an effective property tax rate of 1.22%, these homeowners face a complex web of expenses that extend far beyond the monthly payment they see on their bank statement.
Home maintenance emerges as the single largest burden, consuming 37.71% of all hidden costs at $7,785 per year. The standard 2% maintenance rule, while often overlooked during the home buying process, represents a larger annual expense than property taxes, insurance, and utilities individually. This reality challenges the common perception that property taxes or insurance premiums are the primary concern for homeowners.
Utilities and energy costs claim the second-largest share at 29.36% of hidden expenses, totaling $6,060 annually for the median homeowner. Property taxes account for 20.67% at $4,267 per year, while homeowners insurance represents the smallest portion at 12.26%, or $2,530 annually. These four categories combine to create a financial obligation that adds nearly $1,900 to monthly housing costs before a single mortgage payment is made, fundamentally reshaping the true cost of homeownership in major American cities.
Regional Trends and Surprising Patterns
California's Insurance Advantage Contradicts Conventional Wisdom
While California claims six of the ten most expensive cities for overall homeownership costs, the state offers a surprising benefit in homeowners insurance. San Jose homeowners pay just $1,090 annually for insurance on a $1.38 million home, a rate of 0.08% of property value. Sacramento, Bakersfield, and Fresno all maintain insurance costs below $1,350 per year.
This stands in stark contrast to Oklahoma City, where homeowners pay $7,085 annually to insure a $203,000 home, representing 3.49% of the property value. The insurance disparity means Oklahoma City homeowners spend nearly seven times more on insurance despite having homes worth 85% less than those in San Jose.
The Texas and Oklahoma Insurance Crisis
Texas and Oklahoma cities face a hidden cost crisis driven by skyrocketing homeowners insurance premiums. Houston homeowners pay $6,370 annually, Fort Worth pays $5,825, and Tulsa pays $5,250, all for properties valued well under $300,000. These insurance costs often exceed annual property tax bills in these cities.
Oklahoma City leads the nation with the highest insurance burden at $7,085 per year, more than the annual property taxes paid by homeowners in San Francisco, San Diego, or Los Angeles. The insurance premium epidemic across the South Central region has transformed otherwise affordable housing markets into financial burdens for homeowners.
The Property Tax Rate Paradox
Property tax rates tell a misleading story when examined without context.
Detroit carries the nation's highest effective property tax rate at 3.13%, more than eight times higher than Colorado Springs' 0.39% rate. However, Detroit homeowners pay just $2,468 annually due to the city's $78,807 median home value, the lowest in the study. Meanwhile,
Boston homeowners enjoy the second-lowest tax rate at 0.50% but still pay $3,887 annually due to their $785,239 median home value. Portland homeowners face the opposite extreme with a 2.57% rate generating $13,471 in annual taxes, despite median home values of just $524,552.
Midwest Cities Dominate Affordability Rankings
The Midwest corridor from Ohio to Pennsylvania consistently delivers the lowest hidden homeownership costs in the nation.
Philadelphia, Detroit, Indianapolis, and Columbus all rank in the bottom five for total annual expenses. The region benefits from balanced cost profiles with moderate property values, reasonable tax rates, and manageable insurance premiums.
Milwaukee presents an outlier with utility costs reaching $8,832 annually, the highest in the nation, yet still maintains overall affordability at $21,218 per year due to low property values.
The Utility and Energy Divide
Utility and energy costs vary by nearly 90% across major cities, from Las Vegas' low of $4,644 annually to Milwaukee's high of $8,832.
California cities consistently rank among the highest for utilities, with Oakland at $8,736, Fresno at $8,568, San Francisco at $8,292, and San Jose at $8,148. These elevated utility costs add thousands to annual homeownership burdens even in cities with moderate property values.
Conversely, Southern and Mountain West cities benefit from lower utility expenses, with Jacksonville, Indianapolis, and Las Vegas all maintaining annual utility costs below $5,000.
Methodology
PropFusion analyzed the hidden costs of homeownership across the 50 most populous U.S. cities where complete data was available. The analysis was conducted in November 2025.
Median home values were sourced from Zillow for September 2025. Effective property tax rates were obtained from the Lincoln Institute's July 2024 50-State Property Tax Comparison Study for taxes paid in 2023. Annual property tax amounts were calculated by applying these effective rates to each city's median home value.
Homeowners insurance data was sourced from Nerdwallet. Utility and energy costs, including electricity, gas, water and sewage, waste and recycling, and cable and internet, were obtained from Doxo Insights for 2025.
Home maintenance costs were calculated using the standard industry practice of estimating 2% of a home's value annually for routine upkeep and repairs. This 2% rule accounts for ongoing maintenance expenses such as HVAC servicing, roof repairs, painting, and other regular property maintenance.
Total annual hidden homeownership costs were calculated by summing property taxes, homeowners insurance, utilities and energy, and home maintenance for each city. Cities were then ranked from highest to lowest based on these total annual costs. The median annual cost across all 50 cities was calculated to provide a national benchmark.
Fair Use Statement
Interested in covering this research? We encourage you to use any of the findings, data, or graphics included in this report. We just ask that you please provide attribution to PropFusion by linking back to this page so your readers can explore the full study and its methodology.


Take Control of Your Association’s Future


