The True Cost of Homeownership Index: Annual "Hidden" Expenses Across America's 50 Largest Cities
Purchasing a home typically represents the pinnacle of achieving long-term financial stability.
However, most homeowners tend to grossly underestimate the overall true cost of being a homeowner. In addition to the monthly mortgage payment, homeowners are required to cover additional costs that include property taxes, insurance, utilities, and routine maintenance, which may increase a homeowner's annual expenses by as much as tens of thousands of dollars. The costs associated with owning a home can vary greatly depending on where you live; in fact, in certain metropolitan areas, these costs can be greater than what a family pays in rent each month.
In order to identify the true financial burdens of owning a home in the United States' major cities, PropFusion researched the total annual costs for the 50 most populous U.S. cities. The research incorporated average home prices from Zillow and local property tax rates from the Lincoln Institute, homeowners' insurance costs from NerdWallet, and utility costs from Doxo Insights. A ranking system based on total annual costs for each city was developed and included property taxes, insurance, utilities, energy, and a typical 2 percent home maintenance allowance.
Key Findings
- The median homeowner in America's largest cities pays $20,403 annually in hidden costs beyond their mortgage, including property taxes, insurance, utilities, and maintenance.
- San Jose, California, leads the nation with the highest annual homeownership costs at $54,562, driven by sky-high property values and maintenance expenses.
- Philadelphia, Pennsylvania, offers the most affordable homeownership at $14,284 annually, making it 74% less expensive than San Jose.
- California cities dominate the top tier, claiming 6 of the 10 most expensive cities for homeowners, while Midwest cities like Detroit, Indianapolis, and Columbus rank among the most affordable.
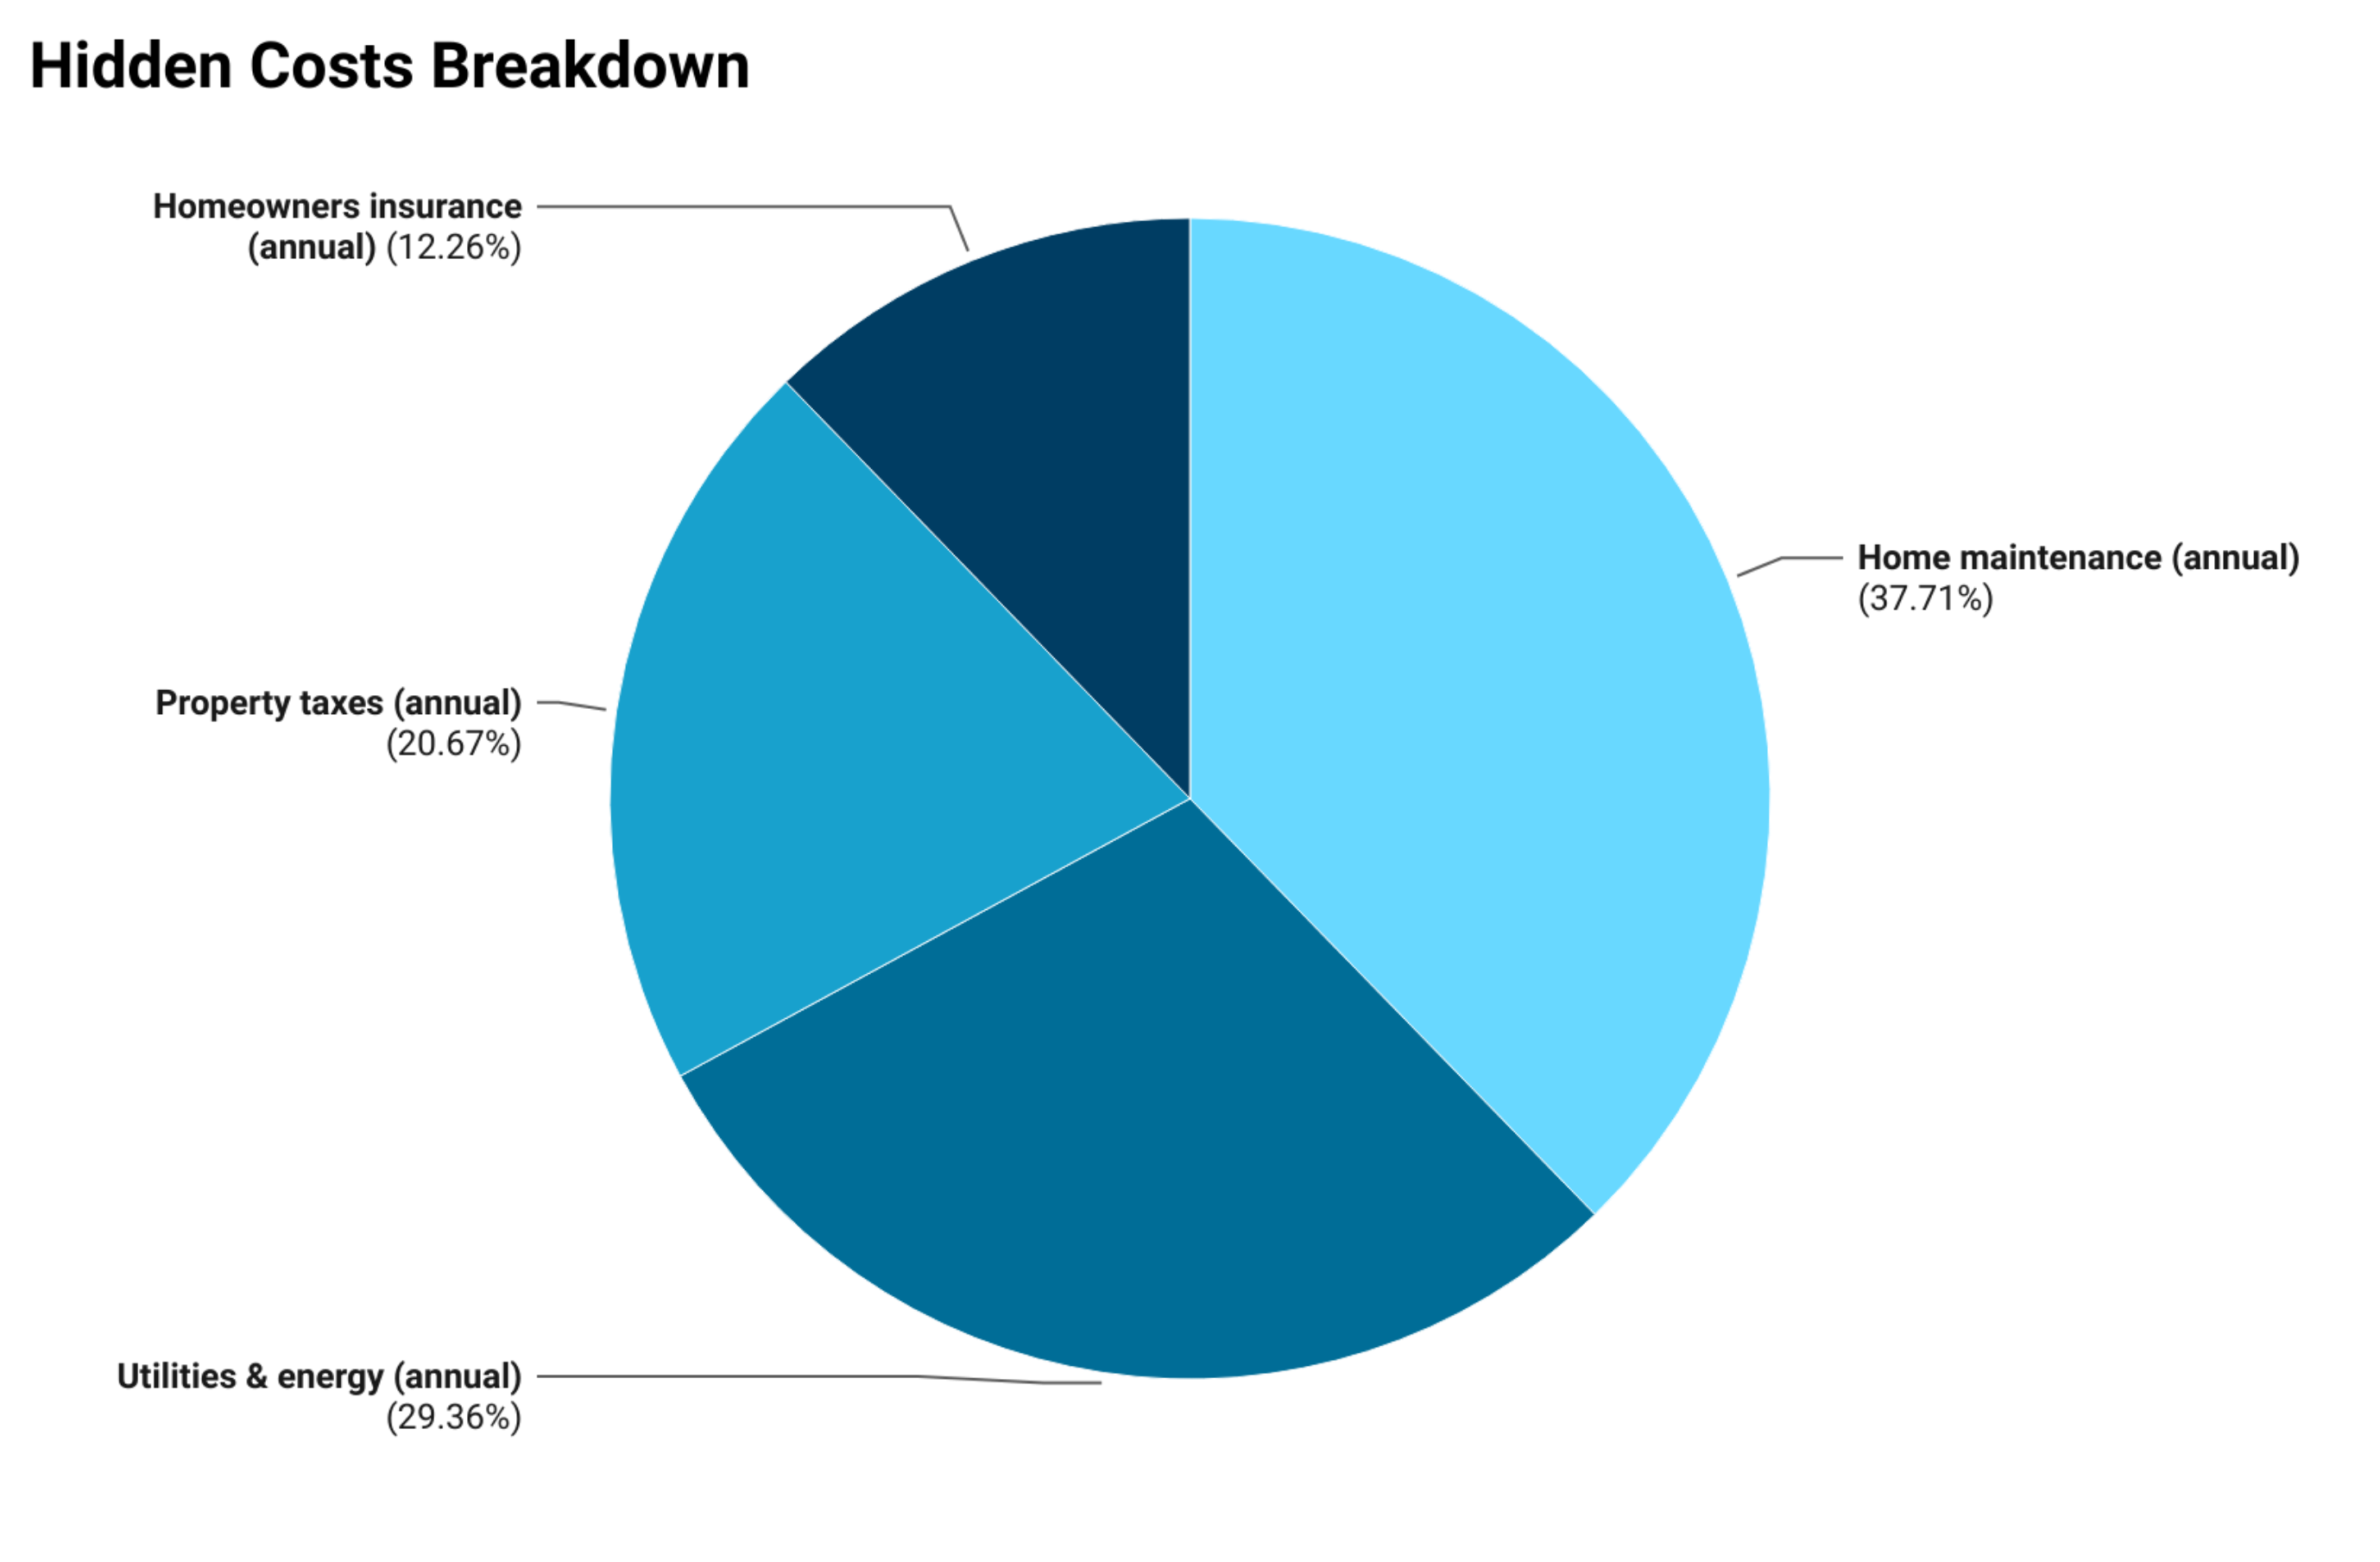
- Home maintenance costs represent the single largest hidden expense for homeowners at a median of $7,785 annually, accounting for 37.71% of all hidden costs, more than property taxes, insurance, and utilities individually.
The Five Cities With the Highest Hidden Homeownership Costs
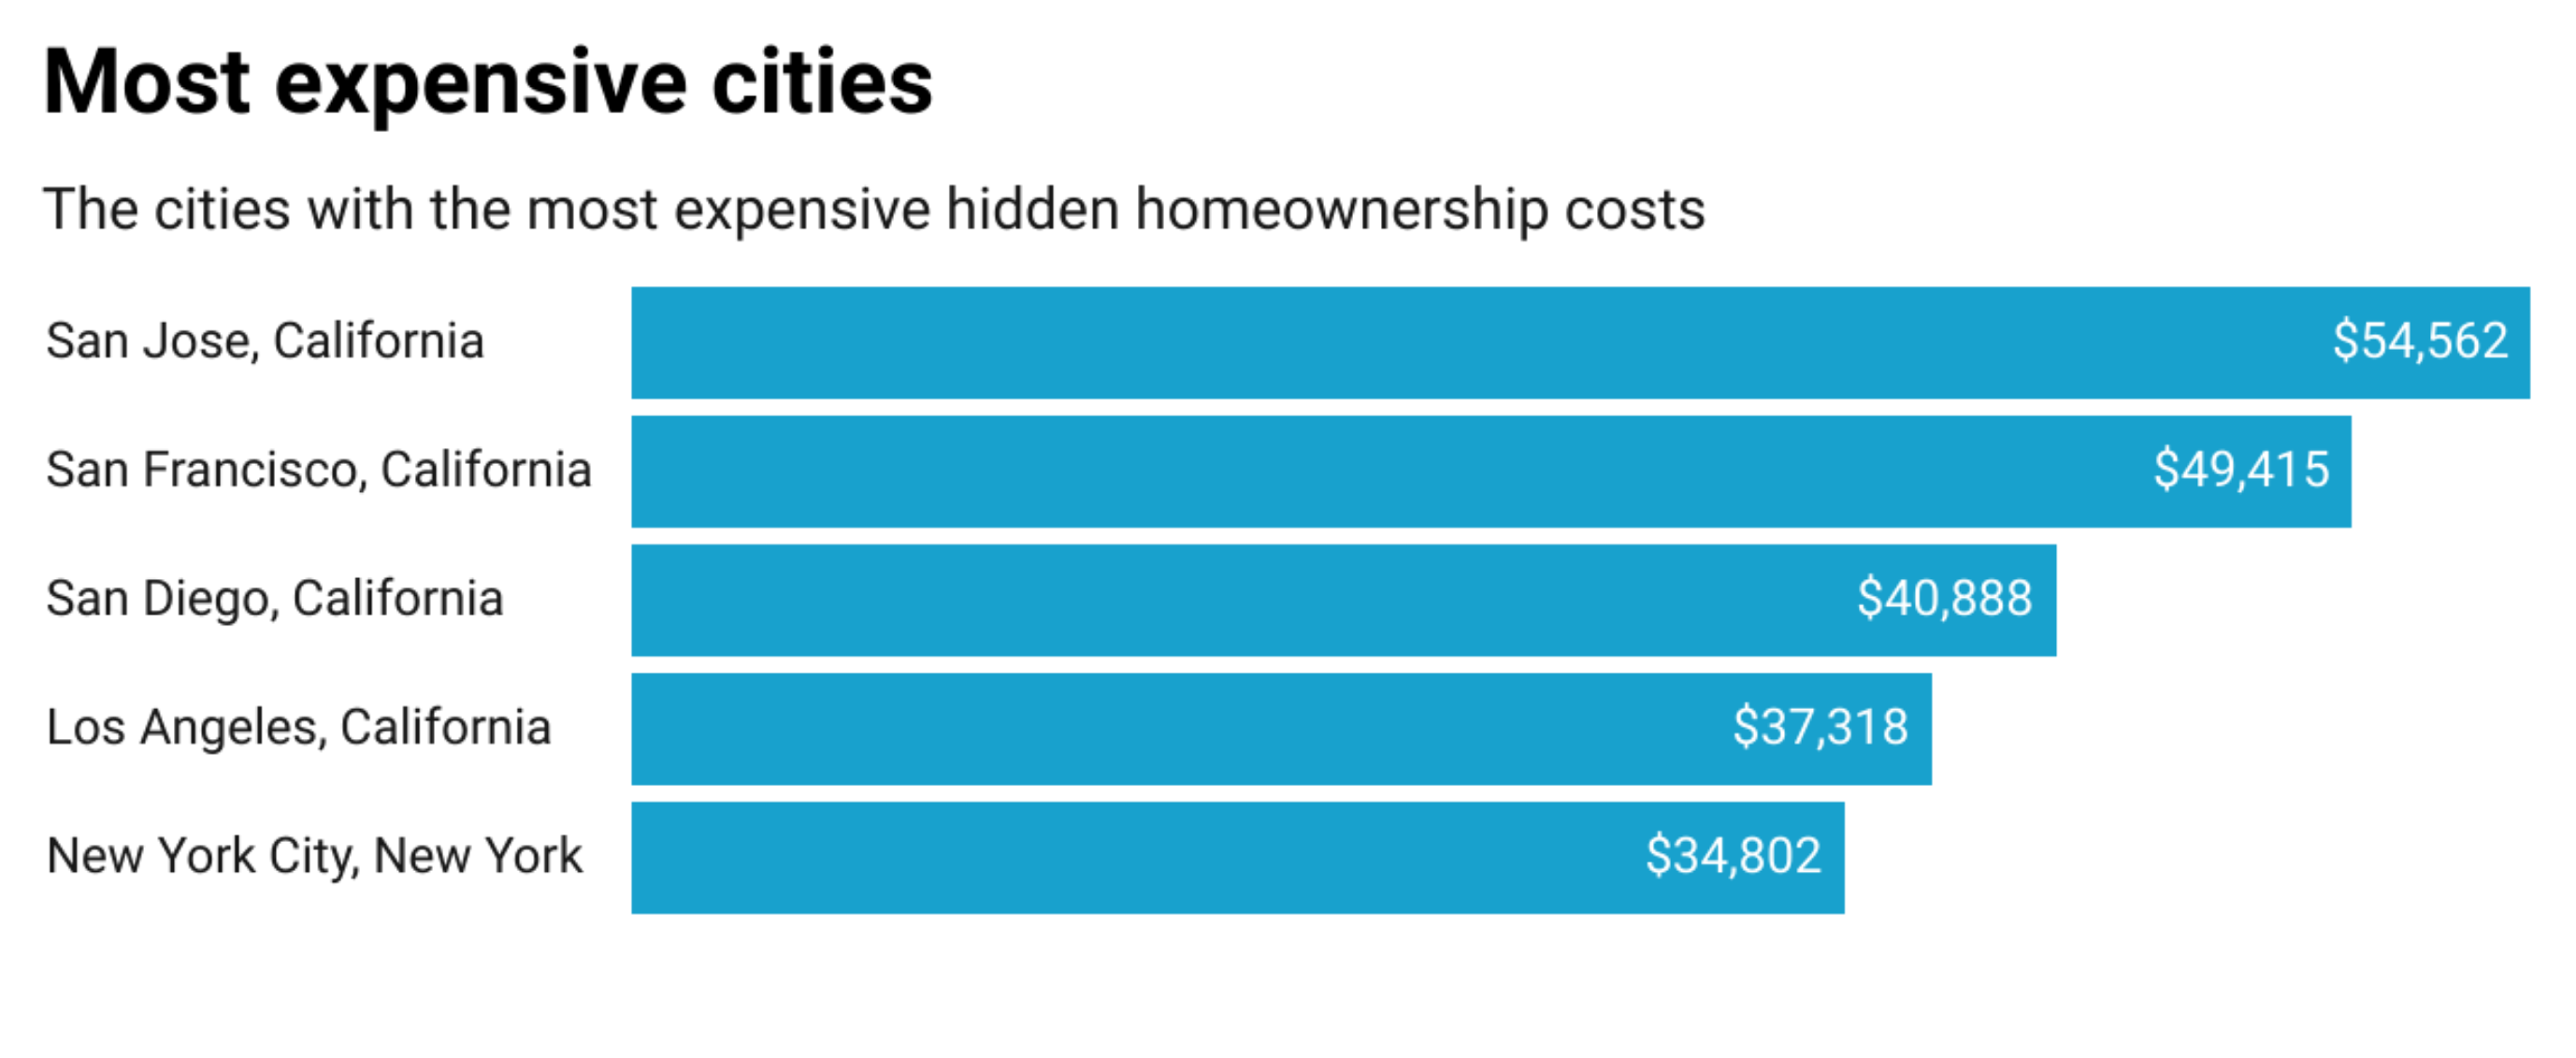
San Jose, California: $54,562 per Year
Homeowners in San Jose have the largest amount of hidden homeowner expenses (over twice the median for the United States) at $54,562 per year. Homeowners in San Jose pay almost half their total hidden homeowner expenses for home maintenance, primarily because they live in such high-priced properties. Surprisingly, San Jose has the lowest homeowners' insurance cost in the country at $1,090 per year (one-sixth of what Oklahoma City homeowners pay), even though the value of the houses is over seven times higher than those in Oklahoma City.
San Francisco, California: $49,415 per Year
Homeowners in San Francisco have $49,415 per year in hidden homeowner expenses, which include the fourth-largest utility and energy expenses in the country. The age of the housing stock in San Francisco, combined with the high cost of energy in California, contributes to the costs being substantially greater than the national averages for property tax, insurance, and other homeownership expenses.
San Diego, California: $40,888 per Year
San Diego ranks third in the United States in terms of homeownership expenses, with $40,888 in annual hidden homeowner expenses. Property taxes and maintenance costs account for the majority of homeownership expenses in San Diego, primarily as a result of median home values exceeding one million dollars in this coastal Southern California market.
Los Angeles, California: $37,318 per Year
Annual hidden homeowner expenses for homeowners in Los Angeles total $37,318, although the city has relatively low utility costs when compared to other expensive markets in California. Although Los Angeles has the fourth-highest median home value in the country, it has lower energy and utility costs than many of its Northern California neighbors.
New York City, New York: $34,802 per Year
Although it is the only non-California city listed in the top five, New York City has homeowners who incur an additional $34,802 in hidden homeowner expenses per year. Insurance costs are the highest of the top five cities, and reflect the risks associated with the density and size of the largest metropolitan area in the United States.
The Five Most Affordable Cities for Hidden Homeownership Costs
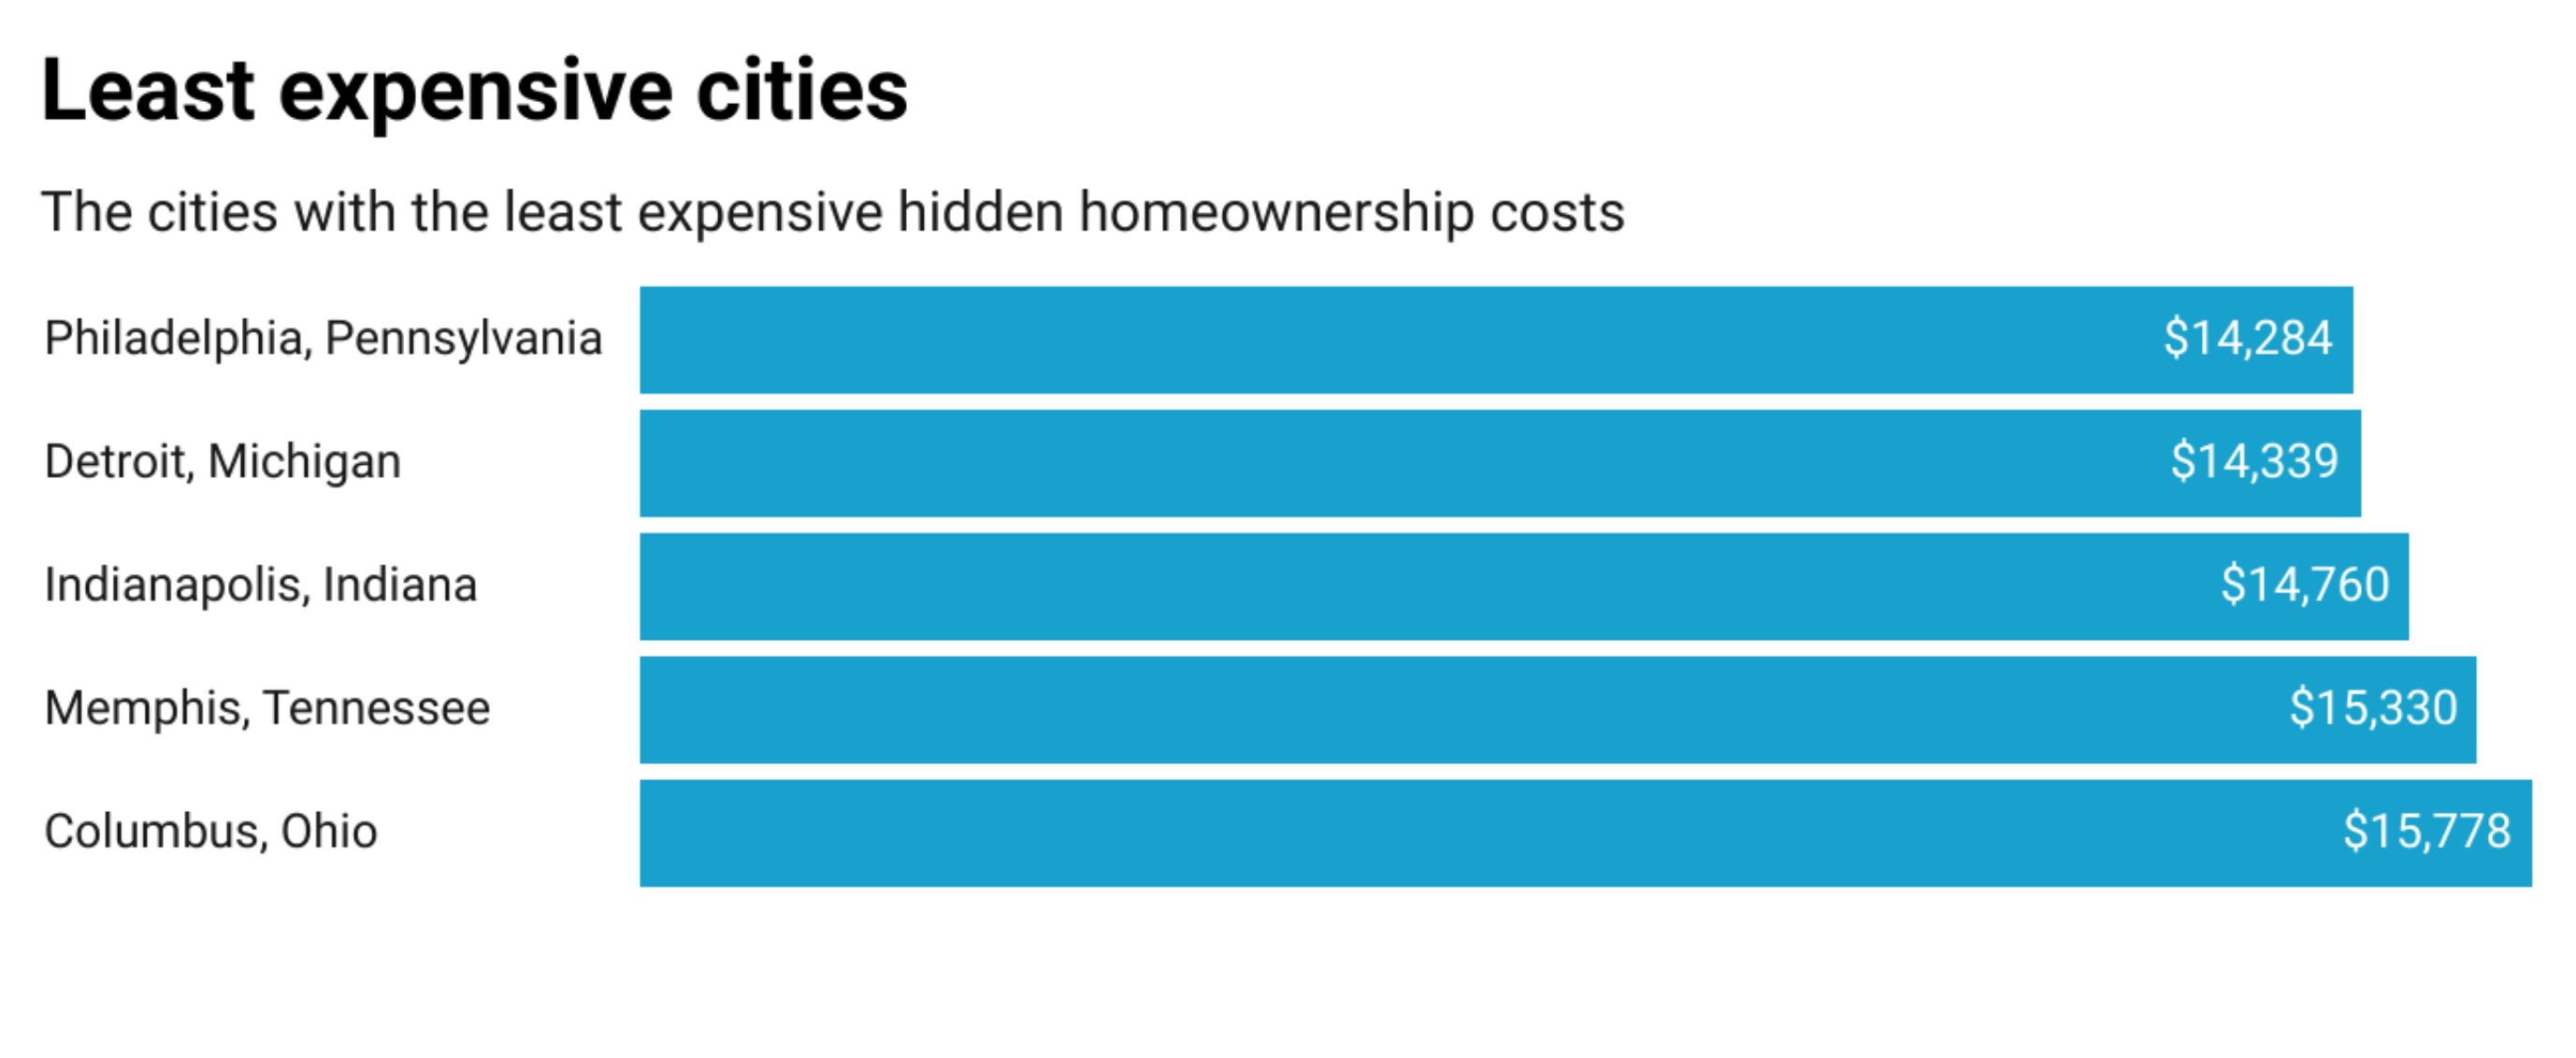
Philadelphia, Pennsylvania - $14,284 per year
Philadelphia has the lowest total of hidden homeownership costs of the 50 largest U.S. cities at $14,284 per year. Philadelphia is 30% lower than the national median for homeownership costs, and is therefore one of the most affordable options for first-time buyers who are looking to purchase a home. Philadelphia’s moderate home prices and moderate tax rates, combined with moderate utility bills, create a very affordable environment for long-term homeownership.
Detroit, Michigan - $14,339 per year
Annual hidden costs of $14,339 make Detroit the second-most affordable city for homeownership costs. While Detroit has the highest tax rate in this study at 3.13% (six times more expensive than many low-tax cities), the city also has the lowest median home price of all the cities studied ($78,807), which helps to keep the overall amount paid affordable despite the high tax rate.
Indianapolis, Indiana - $14,760 per year
With an average of $14,760 for homeownership costs each year, Indianapolis is ranked as the third-most affordable city in terms of hidden homeownership costs. Indianapolis also has the third-lowest utility and energy costs among all 50 cities in this study, which will help extend the life of a homeowner’s budget. With a moderate median home value and moderate insurance costs, Indianapolis is a strong candidate for Midwestern homeownership affordability.
Memphis, Tennessee - $15,330 per year
At an average of $15,330 in annual hidden homeownership costs, Memphis was the fourth-most affordable city in our study. At just $143,248, Memphis had the second-cheapest median home values in the study. However, like Memphis, the utility costs in Memphis were significantly higher than those in many other cities, which would require careful planning for homeowners to ensure they have enough money set aside to pay their ongoing energy costs.
Columbus, Ohio - $15,788 per year
Annual hidden homeownership costs of $15,788 in Columbus make it the fifth-most affordable city in the study. In contrast to many of the other cities studied, Columbus does not have a cost category where expenses stand out as being unusually high or low, creating a very predictable and stable budgetary environment for homeowners in Columbus, Ohio.
Complete Rankings: Hidden Homeownership Costs Across America's 50 Largest Cities
Across America, U.S. homeownership affordability is clearly regional, as shown in the entire rankings.
6 of the top 10 most expensive places are in California, while Midwestern and southern cities consistently appear at the bottom of the list (most affordable).
Texas cities vary greatly; some are among the most expensive, while others are still considered relatively inexpensive.
The data also shows that the annual variation in hidden homeownership costs can be greater than $40,000 per year between the least and most expensive large U.S. cities. This variation has a significant impact on both long-term wealth accumulation and quality of life for all American homeowners.
The American Homeowner: A Financial Portrait
In America's 50 largest cities, the average homeowner pays $20,403 each year for "hidden" costs, above and beyond what is shown as their monthly mortgage. The median home price in America's 50 largest cities is $389,241, and with an effective property tax rate of 1.22%, the average homeowner has a wide array of financial obligations to address, which go well beyond the mortgage payment on their bank statement.
Maintenance of homes takes the greatest toll on homeowners financially. Maintenance accounts for 37.71% of all "hidden" costs. In total, this equals $7,785 annually. It is worth noting that the 2% maintenance rule used by most lenders is typically ignored during the home purchasing process, and when factored into a yearly cost, it will be greater than individual costs for property taxes, insurance, and utility bills combined. The general public would find it surprising that maintenance of a home is the number one expense for homeowners and not property taxes or insurance premiums.
Utilities and energy expenses take second place as the greatest expense (29.36%), equating to $6,060 per year for the average homeowner. Next is property taxes, accounting for 20.67% of all "hidden" expenses ($4,267), followed by homeowners' insurance, which represents the smallest amount at 12.26%, equaling $2,530 per year. When combined, these four categories represent a financial obligation that will increase monthly housing costs by approximately $1,700 before making a single mortgage payment and will significantly alter the actual cost of homeownership in America's largest cities.
Regional Trends and Surprising Patterns
Insurance Rates Lower Than Expected In California
Six of the top ten most costly areas to be a homeowner are found within California, however insurance is significantly cheaper there than expected. For example, the average annual homeowners insurance premium in San Jose for a $1.38 million home is only $1,090, which represents 0.08% of the home's value. Homeowners in Sacramento, Bakersfield and Fresno have average annual premiums that are less than $1,350.
In stark contrast to this are the insurance premiums being paid by homeowners in Oklahoma City. They pay an average annual premium of $7,085 to insure a $203,000 home, which represents 3.49% of the home's value. Thus, Oklahoma City homeowners pay nearly seven times as much for insurance as do San Jose homeowners, who own homes valued at approximately 85 percent less than they do.
Texas and Oklahoma Insurance Problems
Homeowners in Texas and Oklahoma face an "insurance crisis," which is being fueled by rapidly rising homeowners' insurance premiums. For example, the average annual homeowners insurance premium in Houston is $6,370; it is $5,825 in Fort Worth; and it is $5,250 in Tulsa. All of these cities have home prices that are valued at less than $300,000, and many homeowners in these cities are paying more in insurance premiums than they are in property taxes each year.
As such, Oklahoma City has the highest percentage of homeowners paying for insurance in the U.S., with an average annual premium of $7,085. This exceeds the amount paid in property taxes by homeowners in San Francisco, San Diego, and Los Angeles. The growing problem of rising insurance premiums in the southern and central states is turning what was once affordable housing markets into unaffordable housing markets for homeowners.
Paradox of Property Taxes
Detroit has the highest effective property tax rate in the U.S. at 3.13%, while Colorado Springs has the lowest at 0.39%. However, the average annual property tax bill for homeowners in Detroit is $2,468 due to its median home price of $78,807, which is the lowest in the country. Conversely, Boston has the second-lowest effective property tax rate in the U.S. at 0.50%, but the average annual property tax bill for homeowners is $3,887 because of the median home price of $785,239.
The Midwest Continues To Be The Most Affordable Region
For years now, the Midwest corridor from Ohio to Pennsylvania has continued to provide the least expensive hidden homeownership costs for homeowners in the U.S.
Four of the five cities with the lowest total annual homeownership costs are located in the Midwest corridor. Philadelphia, Detroit, Indianapolis and Columbus are all located in this corridor. These four cities can keep their costs so low due to their relatively balanced cost structures, including moderate home prices, reasonably low tax rates and relatively low insurance premiums.
An exception to this is Milwaukee, which has the highest utility costs in the country at $8,832 annually. Yet, Milwaukee homeowners have one of the lowest total annual homeownership costs in the country at $19,193 annually, due to low property values.
Utility and Energy Costs Vary Greatly Across Major U.S. Cities
Utility and energy costs vary by nearly 90% across major U.S. cities. For example, Las Vegas has the lowest average annual utility costs in the country at $4,644, while Milwaukee has the highest average annual utility costs in the country at $8,832.
Additionally, California cities tend to have some of the highest average annual utility costs in the country, with Oakland averaging $8,736, Fresno averaging $8,568, San Francisco averaging $8,292, and San Jose averaging $8,148.
Finally, Southern and Mountain West cities have some of the lowest average annual utility costs in the country, with Jacksonville, Indianapolis, and Las Vegas averaging less than $5,000 per year
Methodology
PropFusion evaluated the hidden costs of owning a home in the top 50 population areas in the United States where data was available. The evaluation of this analysis occurred in November 2025
Median Home Values were derived from the Zillow Housing Data Index. Effective Property Tax Rates were provided by Lincoln Institute's July 2024 report titled "50-State Property Tax Comparison Study" which utilized the amount of taxes that were paid in 2023. The total dollar amount of an individual's property tax for the year is determined by taking their effective property tax rate and multiplying it by their city's median home value.
The cost of homeowner's insurance was obtained from NerdWallet. Utility and Energy Costs, including Electricity, Gas, Water/Sewerage, Waste/Recycling and Cable/Internet were obtained from Doxo Insights for 2025.
Home Maintenance Costs were estimated at 2% of a home's value per annum for general routine maintenance and repairs; a commonly used estimate to determine general property maintenance and repair costs (i.e., HVAC servicing, Roof Repairs, Painting, etc.).
Annual Hidden Homeownership Costs were determined by adding property taxes, Homeowner's Insurance, Utilities & Energy and Home Maintenance for each of the cities. The cities were then ranked in order from the greatest to least in terms of total annual costs. A National Benchmark was established by determining the Median Annual Cost of all 50 cities.
Fair Use Statement
Interested in covering this research? We encourage you to use any of the findings, data, or graphics included in this report. We just ask that you please provide attribution to PropFusion by linking back to this page so your readers can explore the full study and its methodology.
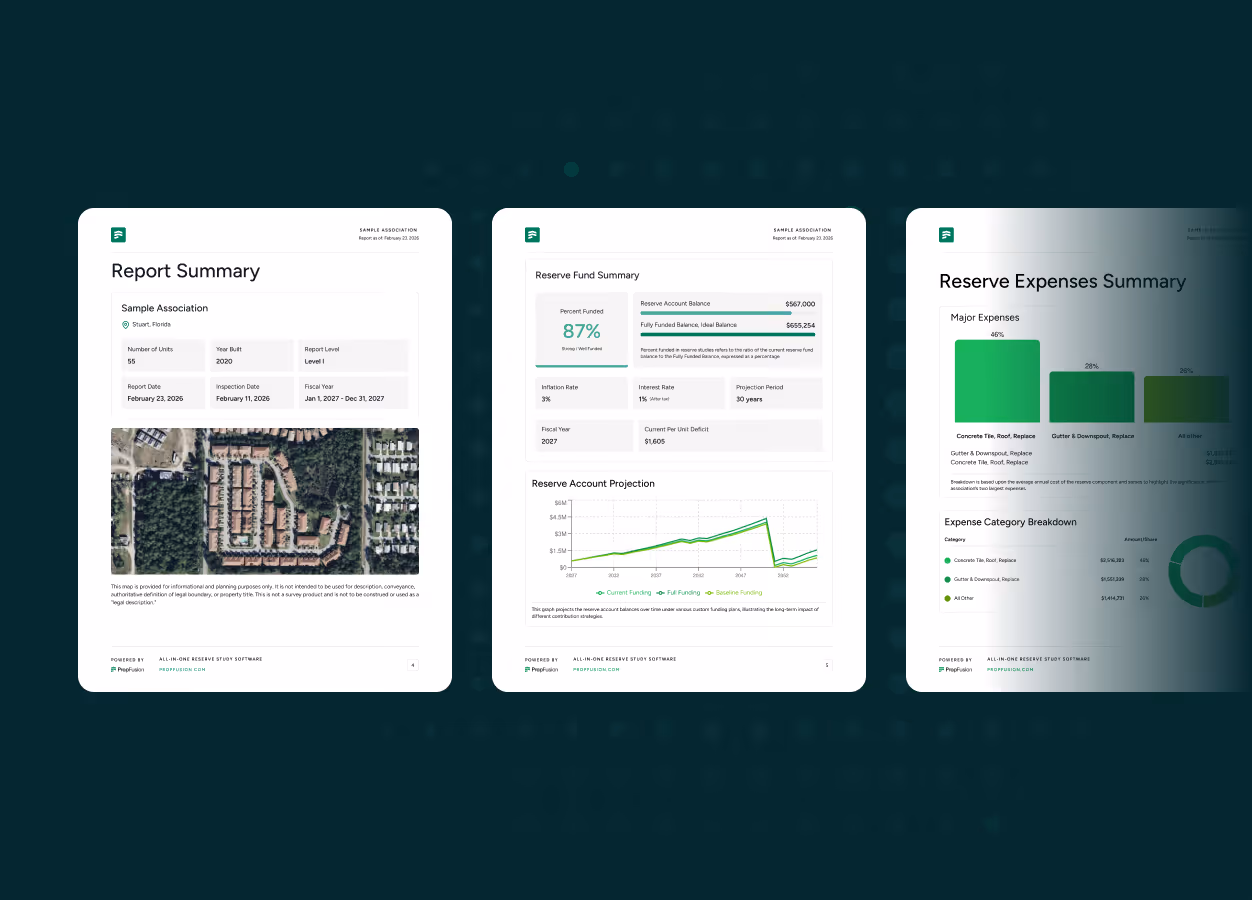
Take the guesswork out of choosing a reserve study company
PropFusion connects you with a vetted network of Reserve Study experts in your state, ensuring best industry standards.